How to use RSI for Trading Success

Relative Strength Index (RSI)


A momentum indicator developed by J. Welles Wilder Jr. (1978) that measures the speed and magnitude of price changes. Traders use RSI to identify whether a stock is overbought or oversold.

RSI Scale

RSI moves between 0 and 100.

RSI Formula (Simple Version)

  • RS = Average Gains / Average Losses
  • RSI = 100 – [100 / (1 + RS)]

(You don’t usually need to calculate it manually—charting tools do it automatically.)

How to Read RSI

Overbought (RSI > 70)

  • An RSI above 70 suggests that the asset may be overbought, indicating a potential price correction.

Oversold (RSI < 30)

  • An RSI below 30 suggests the asset may be oversold, indicating a possible rebound.

Example Chart Explanation
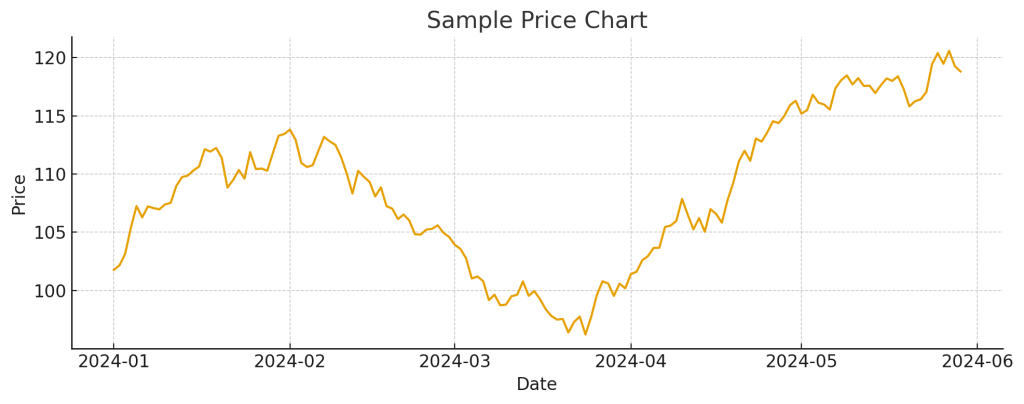
1. Price Chart

(shows the stock’s price movement over time.)
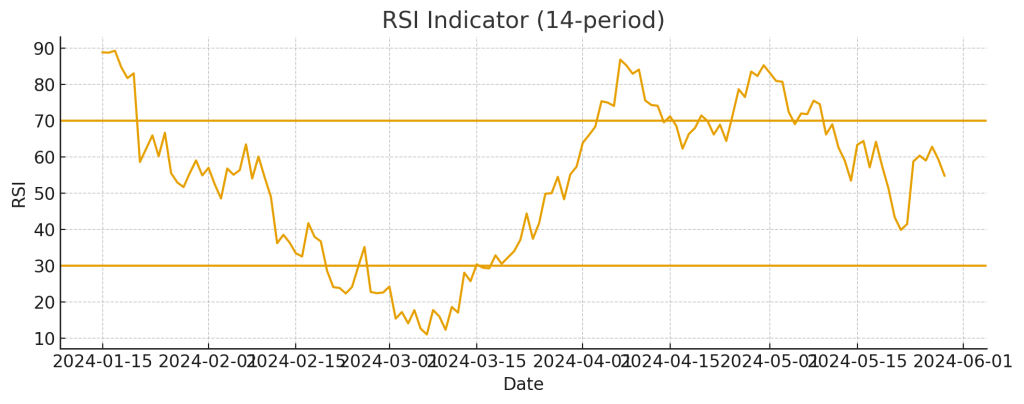
2. RSI Chart

(shows RSI oscillating between 0 and 100 with reference lines at 30 and 70.)

Overbought Example

When RSI rises above 70:

  • Momentum is strong but may be overstretched.
  • When RSI turns back below 70, the price often slows down or pulls back.

Oversold Example

When RSI falls below 30:

  • Indicates strong downside pressure.
  • When RSI rises above 30, price often stabilizes or rebounds.

How Traders Use RSI

  1. Entry Signal (Buy) : RSI crosses above 30 → possible buying opportunity.
  2. Exit Signal (Sell) : RSI crosses below 70 → possible selling signal.
  3. Trend Reversals (Divergence) Traders watch for differences between price movement and RSI movement:
    • Bullish Divergence:
      Price makes lower lows, but RSI makes higher lows.
      → Suggests a potential upward reversal.
      → Buy when RSI crosses above 30.
    • Bearish Divergence:
      Price makes higher highs, but RSI makes lower highs.
      → Suggests a potential downward reversal.
      → Sell when RSI crosses below 70.

Limitations

  • RSI can stay overbought or oversold for long periods during strong trends.
  • It may give false signals in sideways or choppy markets.
  • Works best when combined with price action, moving averages, MACD, or volume confirmation.

Conclusion

The RSI is a simple yet powerful indicator that helps traders understand momentum and identify potential turning points in the market. While it provides helpful signals for entries, exits, and trend reversals, it should not be used alone. Combining RSI with other technical tools and overall market context leads to more reliable and confident trading decisions.


Understanding Moving Averages in Trading

Moving Average (MA)

A moving average represents the average price of a security over a specific period, helping traders smooth out short-term price fluctuations and identify overall trends.

Types of Moving Averages

TypePeriod CoveredUsageTrend Focus
200-Day Moving Average (200-DMA)Last 200 trading daysLong-term trend identificationBroad market direction
50-Day Moving Average (50-DMA)Last 50 trading daysShort- to intermediate-term analysisRecent price momentum

How to Interpret a Moving Average

Golden Cross (Bullish Signal)

Definition:
Occurs when the 50-DMA crosses above the 200-DMA.

Interpretation:
→ Signals a bullish trend, indicating potential long-term upward momentum.
The crossover shows that short-term momentum is overtaking long-term averages, suggesting renewed market strength.

Confirmation:
Traders look for increasing trading volumes or other indicators (like RSI or MACD) to validate the uptrend.

Death Cross (Bearish Signal)

Definition:
Occurs when the 50-DMA crosses below the 200-DMA.

Interpretation:
→ Signals a bearish trend, indicating potential long-term downward momentum.
This suggests that short-term weakness is overtaking long-term support levels.

Confirmation:
Traders often seek validation through
• A break of key support levels
Declining trading volumes
• Other bearish indicators

Example: Golden Cross – Northern ARC Capital Ltd

Northern ARC Capital Ltd (Chart source : https://www.screener.in)

In the chart above:

  • The blue line represents the price movement of the stock on NSE.
  • The orange line is the 50-Day Moving Average (50-DMA) — short- to mid-term trend indicator.
  • The grey line is the 200-Day Moving Average (200-DMA) — long-term trend indicator.
  • The light blue bars show the trading volume.

Observations

  1. October 2024 – March 2025:
    The stock remained in a downtrend, with the 50-DMA below the 200-DMA — a bearish phase. Prices continued to decline as momentum weakened.
  2. April – June 2025:
    The price started recovering, forming higher lows. The 50-DMA began to turn upward, indicating strengthening short-term momentum.
  3. June – July 2025: The Golden Cross
    The 50-DMA crossed above the 200-DMA, forming a Golden Cross — a bullish signal suggesting a potential long-term uptrend was beginning.
    This crossover was also supported by a spike in trading volume, adding credibility to the move.
  4. August – October 2025:
    After the crossover, prices continued to trend upward, confirming the bullish reversal.

Summary

  • A Moving Average helps visualize the trend by averaging prices over time.
  • The 50-DMA tracks short- to mid-term momentum, while the 200-DMA tracks long-term direction.
  • Golden Cross → Bullish trend may be forming.
  • Death Cross → Bearish trend may be developing.
  • Always confirm signals using other indicators (RSI, MACD, Volume) before making trading decisions.

Quick Insight: RSI and MACD

Relative Strength Index (RSI):
A momentum indicator that measures the speed and magnitude of price changes.

  • RSI ranges from 0 to 100
  • Above 70 → overbought (potential pullback)
  • Below 30 → oversold (potential rebound)

Moving Average Convergence Divergence (MACD):

A trend-following momentum indicator that shows the relationship between two moving averages of a stock’s price.

  • MACD line crossing above the Signal line → bullish signal
  • MACD line crossing below the Signal line → bearish signal

These indicators help traders confirm whether a Golden Cross or Death Cross is supported by momentum strength or weakness.

Your Turn

Have you ever used moving averages to identify entry or exit points in your trades?
What signals or confirmations do you rely on most — the crossover itself, volume trends, or other indicators?