Moving Average (MA)
A moving average represents the average price of a security over a specific period, helping traders smooth out short-term price fluctuations and identify overall trends.
Types of Moving Averages
| Type | Period Covered | Usage | Trend Focus |
|---|---|---|---|
| 200-Day Moving Average (200-DMA) | Last 200 trading days | Long-term trend identification | Broad market direction |
| 50-Day Moving Average (50-DMA) | Last 50 trading days | Short- to intermediate-term analysis | Recent price momentum |
How to Interpret a Moving Average
Golden Cross (Bullish Signal)
Definition:
Occurs when the 50-DMA crosses above the 200-DMA.
Interpretation:
→ Signals a bullish trend, indicating potential long-term upward momentum.
The crossover shows that short-term momentum is overtaking long-term averages, suggesting renewed market strength.
Confirmation:
Traders look for increasing trading volumes or other indicators (like RSI or MACD) to validate the uptrend.
Death Cross (Bearish Signal)
Definition:
Occurs when the 50-DMA crosses below the 200-DMA.
Interpretation:
→ Signals a bearish trend, indicating potential long-term downward momentum.
This suggests that short-term weakness is overtaking long-term support levels.
Confirmation:
Traders often seek validation through
• A break of key support levels
• Declining trading volumes
• Other bearish indicators
Example: Golden Cross – Northern ARC Capital Ltd
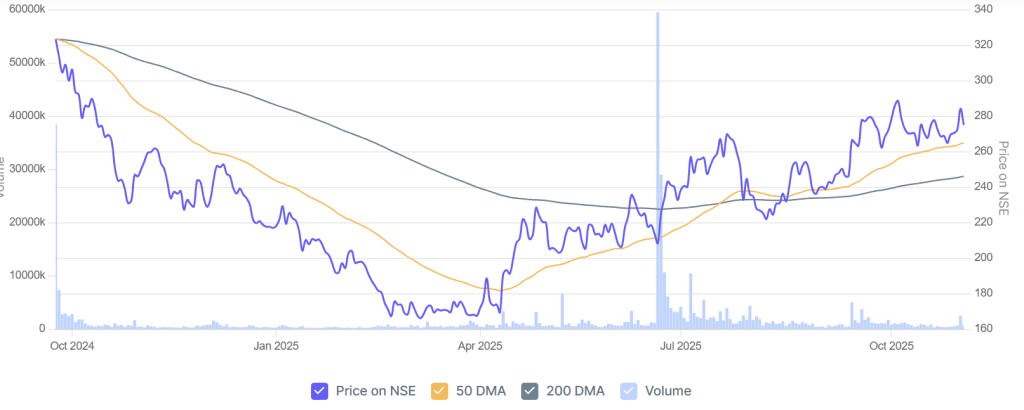
In the chart above:
- The blue line represents the price movement of the stock on NSE.
- The orange line is the 50-Day Moving Average (50-DMA) — short- to mid-term trend indicator.
- The grey line is the 200-Day Moving Average (200-DMA) — long-term trend indicator.
- The light blue bars show the trading volume.
Observations
- October 2024 – March 2025:
The stock remained in a downtrend, with the 50-DMA below the 200-DMA — a bearish phase. Prices continued to decline as momentum weakened. - April – June 2025:
The price started recovering, forming higher lows. The 50-DMA began to turn upward, indicating strengthening short-term momentum. - June – July 2025: The Golden Cross ✨
The 50-DMA crossed above the 200-DMA, forming a Golden Cross — a bullish signal suggesting a potential long-term uptrend was beginning.
This crossover was also supported by a spike in trading volume, adding credibility to the move. - August – October 2025:
After the crossover, prices continued to trend upward, confirming the bullish reversal.
Summary
- A Moving Average helps visualize the trend by averaging prices over time.
- The 50-DMA tracks short- to mid-term momentum, while the 200-DMA tracks long-term direction.
- Golden Cross → Bullish trend may be forming.
- Death Cross → Bearish trend may be developing.
- Always confirm signals using other indicators (RSI, MACD, Volume) before making trading decisions.
Quick Insight: RSI and MACD
Relative Strength Index (RSI):
A momentum indicator that measures the speed and magnitude of price changes.
- RSI ranges from 0 to 100
- Above 70 → overbought (potential pullback)
- Below 30 → oversold (potential rebound)
Moving Average Convergence Divergence (MACD):
A trend-following momentum indicator that shows the relationship between two moving averages of a stock’s price.
- MACD line crossing above the Signal line → bullish signal
- MACD line crossing below the Signal line → bearish signal
These indicators help traders confirm whether a Golden Cross or Death Cross is supported by momentum strength or weakness.
Your Turn
Have you ever used moving averages to identify entry or exit points in your trades?
What signals or confirmations do you rely on most — the crossover itself, volume trends, or other indicators?
