Understanding ROCE: A Key Metric for Business Efficiency

What is Return on Capital Emplyed (ROCE)?

ROCE is a crucial metric to assess how efficiently a company is utilizing its capital employed to generate profits. It provides insight into how well the company is using both equity and debt to generate returns for it’s stakeholders.

Here’s a quick breakdown of the formula and its components:

  • ROCE = EBIT / Capital Employed

Where:

  • EBIT (Earnings Before Interest and Taxes): This measures the operating profitability of a company before considering interest and taxes.
  • Capital Employed: This represents the total funds employed in the business, calculated as Total Assets – Current Liabilities. Alternatively, it can be understood as the sum of Equity capital + Non-current liabilities (long-term debt).

Why is ROCE important?

  1. Measures Efficiency: ROCE indicates how much return is generated for each dollar of capital employed, making it a critical efficiency metric.
  2. Importance in Capital-Intensive Industries: It’s especially useful for comparing companies in industries that require significant investments in assets, such as manufacturing or utilities.
  3. Comparison Across Firms: A higher ROCE signifies more efficient use of capital and can be a key differentiator when evaluating companies with similar operations.

ROCE – Limitations

  • Unutilized Cash: If a company has large reserves of unutilized cash, it might distort the ROCE figure, making it less meaningful.
  • Fluctuations in Capital: Since capital employed can change over time, the timing of the calculation can affect the accuracy of the ROCE.
  • Some analysts may choose to calculate ROCE based on the average capital employed based on the average of opening and closing capital employed.

Example: Hindustan Unilever Ltd (HUL) ROCE Calculation

₹ in Crores Mar-24 Mar-23 Mar-22 Mar-21
EBIT 14,264 13,460 11,980 10,723
Total Assets (A) 78,499 73,087 70,517 68,757
Current Liabilities (B)12,876 12,028 11,280 11,103
Capital Employed (A – B)65,623 61,059 59,237 57,654
ROCE (%)22%22%20%19%
ROCE Calculation – Hindustan Unilever (HUL)

Note: 1 Crore =10 Mn

HUL Data source: Moneycontrol

Observation:

Hindustan Unilever’s ROCE improved from 19% in March 2021 to 22% in March 2024, indicating increased efficiency in utilizing its capital to generate profits.

Conclusion

In essence, ROCE provides a holistic view of how well a company is generating profits from its long-term funding sources (both equity and debt).

Investing ideas:

Companies with rising or stable ROCE tend to be attractive to investors, as they reflect efficient capital management and potential for long-term growth. On the other hand, companies with declining or volatile ROCE might signal inefficiency or difficulties in maintaining profitability.
Impact of Interest Rate Changes on Bond Prices and Debt Fund Returns

Understanding the Inverse Relationship Between Bond Prices and Interest Rates

Bonds pay a fixed interest, known as the coupon rate. When market interest rates change, the value of existing bonds adjusts to align with newly issued bonds at the current rates, leading to an inverse relationship between bond prices and interest rates.

Impact of Interest Rate Movements on Bonds and Debt Funds

1. Rising Interest Rates:

  • Effect on Bonds: When interest rates rise, new bonds are issued with higher coupon rates (e.g., 6%). This makes existing bonds with lower coupon rates (e.g., 5%) less attractive. To compensate for the lower yield, the price of these bonds must fall to offer a comparable yield to new bonds.
  • Example:
    If you hold a bond with a face value of ₹1000 and a coupon rate of 5% (₹50 interest annually), when new bonds are issued at 6%, investors will demand a lower price for your bond. To match the 6% yield, the bond’s price must fall below ₹1000.
  • Effect on Debt Funds: Since the prices of existing bonds fall, the Net Asset Value (NAV) of debt mutual funds also decreases, resulting in lower returns.

2. Falling Interest Rates:

  • Effect on Bonds: When interest rates fall, new bonds are issued with lower coupon rates (e.g., 4%). Existing bonds with higher coupon rates (e.g., 5%) become more attractive, increasing their market value.
  • Example:
    If interest rates drop and new bonds are issued at 4%, your bond with a 5% coupon rate becomes more desirable. Investors would pay more than ₹1000 for your bond, boosting its price.
  • Effect on Debt Funds: The increase in bond prices leads to capital gains for bondholders, resulting in higher returns for debt mutual funds.

Investment Strategies for Managing Interest Rate Risk in Debt Funds

Rising Interest Rate Scenarios:

  • Short-Duration Funds:
    In a rising interest rate environment, short-duration bonds or debt funds are preferable. These bonds mature quickly, allowing reinvestment at higher rates without significant price depreciation.
    • Why? Short-term bonds are less sensitive to interest rate changes, reducing the impact of rising rates on bond prices.
    • Funds to Consider: Liquid funds, ultra-short-term bond funds.

Falling Interest Rate Scenarios:

  • Long-Duration Funds:
    Long-duration bonds gain the most during falling interest rates because their prices increase more with the decline in interest rates.
      • Why? Longer-duration bonds lock in higher coupon rates, and their prices rise as newer bonds are issued at lower rates.
      • Funds to Consider: Gilt funds, long-duration debt funds.
    • Dynamic Bond Funds:
      These funds adjust the portfolio’s duration based on the interest rate outlook. Fund managers switch between long and short-term bonds depending on market expectations, allowing investors to gain in both rising and falling interest rate environments.

    Other Strategies:

    • Fixed Maturity Plans (FMPs):
      FMPs lock in yields for a fixed term, offering stable returns. They may not be as attractive in a rising interest rate environment, but in stable or falling rate periods, they provide predictable returns, insulating investors from market fluctuations.

    Key Takeaways for Investors:

    • Monitor the Interest Rate Environment: Investors should keep an eye on interest rate trends to adjust their portfolio allocations accordingly.
    • In Rising Rate Scenarios: Focus on short-duration funds or strategies that reduce interest rate risk.
    • In Falling Rate Scenarios: Consider long-duration funds or dynamic bond funds to capture gains from rising bond prices.
    • Use FMPs for Stability: In stable or falling rate environments, FMPs offer predictable returns with lower risk.

    By following these strategies, investors can improve their returns while managing the risk associated with fluctuating interest rates in debt mutual funds.

    Understanding Debt Mutual Funds: Risks and Benefits Explained

    A Common Investor Story

    Ramesh is a 45-year-old salaried professional. He doesn’t like the ups and downs of the stock market, but fixed deposits no longer give him the returns he wants. His bank relationship manager suggests debt mutual funds, calling them “safe,” “stable,” and “better than FDs.”

    Reassured by words like bonds, fixed income, and low risk, Ramesh invests a part of his savings in a debt mutual fund, expecting steady returns and easy liquidity.

    But is a debt mutual fund really risk-free?

    What Are Debt Mutual Funds?

    Debt mutual funds invest your money in instruments such as:

    • Government securities
    • Corporate bonds and debentures
    • Treasury bills and money market instruments

    These investments pay interest, which is why debt funds are often seen as safer and more predictable than equity mutual funds.


    Why Debt Mutual Funds Feel Safer Than Equity Funds

    1. Regular Income from Bonds

    Unlike shares, bonds promise interest payments and repayment of principal at maturity. This makes debt funds feel more secure than equity funds, where returns depend entirely on market prices.

    2. Lower Day-to-Day Fluctuations

    Debt fund NAVs usually move slowly compared to equity funds. This lower volatility attracts investors who want stability or are investing for short- to medium-term goals.


    The Risks Most Retail Investors Overlook

    Despite their conservative image, debt mutual funds carry risks that often surface only during difficult times.


    1. Credit Risk – When the Borrower Doesn’t Pay

    Credit risk arises when the company or institution that issued the bond fails to pay interest or return the principal.

    Why it matters:
    To earn higher returns, some debt funds invest in bonds issued by weaker or lower-rated companies. If such a borrower defaults, the fund’s value can fall sharply—sometimes overnight.

    Real-life reminder:
    In 2018, IL&FS, a company rated AAA, suddenly defaulted on its debt. Several debt mutual funds had exposure to its bonds and commercial paper. Investors who expected “safe” returns were shocked to see losses and write-downs. The event also triggered panic across NBFC and housing finance stocks, proving that credit risk can appear without warning.


    2. Interest Rate Risk – When Rates Move Against You

    Bond prices and interest rates move in opposite directions.

    What this means for you:

    • If interest rates rise, existing bonds lose value, pulling down the fund’s NAV.
    • If interest rates fall, bond prices rise, benefiting the fund’s NAV.

    Debt funds that hold long-term bonds are more sensitive to interest rate changes and can show noticeable ups and downs, even without any default.


    3. Liquidity Risk – Getting Your Money When You Need It

    Liquidity risk occurs when many investors try to exit the fund at the same time.

    What can go wrong:
    During market stress, a fund may struggle to sell its bonds quickly. This can force the fund to sell at poor prices or, in extreme cases, restrict withdrawals—something many retail investors assume can never happen.


    What This Means for Investors Like Ramesh

    Debt mutual funds are not the same as fixed deposits. They:

    • Do not guarantee returns
    • Can fall in value
    • Are exposed to market events and credit quality

    They can be useful tools—but only when chosen carefully and matched to the right goal and time horizon.


    A Practical Investment Tip for Retail Investors

    Before investing in any debt mutual fund, look at the monthly fact sheet. Focus on:

    • How much of the portfolio is in AAA-rated bonds
    • Exposure to lower-rated or unrated instruments
    • Average maturity and duration compared to the benchmark

    If the fund is taking extra credit risk to show higher returns, make sure you are comfortable with that risk.


    Understanding Index Funds: Advantages, Disadvantages and Suitability

    What are Index funds?

    Index funds are mutual funds or exchange-traded funds (ETFs) designed to replicate the performance of a specific market index, such as the S&P 500, Nifty 50, or S&P BSE Sensex. They follow passive investment strategy, meaning they do not require frequent trading or active management.

    The goal of an index fund is to match the returns of the index it tracks by holding all or a representative sample of the securities in that index.

    John Bogle, Vanguard founder, is credited with pioneering the concept of Index funds by creating the first-ever index fund Vanguard 500 fund in 1976. This fund was designed to passively track the returns of the S&P 500, an index representing the 500 largest publicly traded companies in the U.S. His innovation democratized investing, particularly in an era dominated by costly brokerage services, and shifted the focus toward long-term growth over short-term trading. This strategy has had a profound and lasting impact on the investment landscape.

    Advantages of Index Funds:

    1. Low Expense Ratios: Since index funds follow a passive investing approach, they tend to have lower management fees compared to actively managed funds. This is because they do not require portfolio managers to make decisions about which securities to buy and sell.
    2. Diversified Portfolio: By tracking an index, these funds automatically spread investments across a large number of securities (stocks or bonds), which helps reduce the risk associated with investing in individual securities.
    3. Simplicity: Index funds are straightforward and easy to understand for most investors. The goal is simply to match the performance of the index, and no active management decisions are needed.
    4. Lower Turnover: Because the funds only buy or sell securities when the composition of the index changes, they tend to have lower transaction costs and capital gains taxes.

    Disadvantages of Index Funds:

    1. No Flexibility in Portfolio Management: Index funds follow a rigid structure by adhering to the composition of the index, leaving no room for managers to make decisions to potentially outperform the market.
    2. Market Downturns: Index funds offer no protection from overall market declines. Since they are designed to mirror the index, if the market goes down, the fund’s value will decrease as well.
    3. Average Returns: Since index funds are designed to match the market, they will typically offer average returns compared to the market as a whole. Index funds will not suit investors looking for above-market returns .

    In summary, index funds are suitable for investors seeking a low-cost, diversified, and long-term investment strategy that tracks the broader market’s performance. They are ideal for investors who prefer not to engage in active trading and market timing.

    Effective Interest Rate

    Effective Interest Rate (EIR) is an important tool to understand your actual return on investment against a stated annual interest rate (also known as the nominal rate) and it can be different from stated interest rate due to the effect of compounding.

    It’s fascinating how the stated annual interest rate can differ from the actual return due to compounding. The Effective Interest Rate (EIR) or Annual Equivalent Rate (AER) takes into account the impact of compounding periods, which can lead to a higher return than the nominal rate suggests.

    When interest compounds more frequently than annually—like monthly or quarterly—the actual return on your investment increases. The EIR provides a clearer picture of this, showing how much interest you’ll effectively earn in a year considering the frequency of compounding.

    For instance, if your bank manager says you’re getting a 10% return compounded monthly, the EIR will be higher than 10% because interest is being added to your balance each month, and you then earn interest on the interest.

    Formula

    Effective Interest Rate = (1+i/n)^n-1

    Where

    i = stated interest rate

    n = Number of compounding periods

    Example:

    Bank is offering interest @ 10% compounded monthly on an investment of $ 1000.

    Required: Calculate Effective Interest Rate

    Effective Interest Rate = [(1+10%/12)^12]-1 = 10.47%

    Let’s verify this will actual calculation table below:

    Month Opening Balance ($)Monthly Interest @ 10% Closing Balance ($)
    110008.31008.3
    21008.38.41016.7
    31016.78.51025.2
    41025.28.51033.8
    51033.88.61042.4
    61042.48.71051.1
    71051.18.81059.8
    81059.88.81068.6
    91068.68.91077.5
    101077.591086.5
    111086.59.11095.6
    121095.69.11104.7
    Total Interest104.7
    Interest compounded monthly @ 10%

    It is evident that actual return is 10.47% with interest of $104.7 on monthly compounding against the stated interest rate of 10%.

    Diluted Earnings per share

    Contents:

    1. Diluted EPS
    2. Calculation of Diluted EPS
      • Diluted EPS using if converted method
      • Diluted EPS using Treasury stock method
    3. Antidilutive security

    Diluted EPS

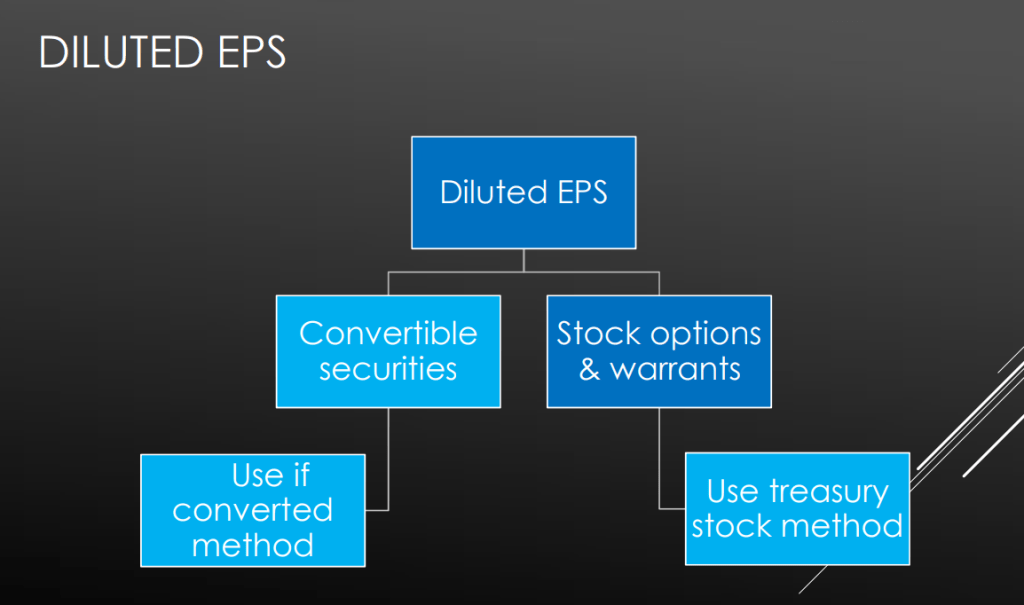
    Diluted EPS reflects the effect of all the company’s securities whose conversion / exercise would result in a dilution (reduction) of basic EPS.

    Dilutive securities includes:

    1. convertible debt,
    2. convertible preferred shares,
    3. warrants,
    4. Options
    5. Employee stock options

    Calculation of Diluted EPS

    Diluted EPS =

    (Net income available for common stockholders + Income adjustments due to dilutive financial instruments) / (Weighted average number of shares outstanding + Newly issuable shares due to dilutive financial instruments)

    Diluted EPS on Convertible Preference shares using if converted method:

    The conversion of preference shares has two effects on diluted EPS formula:

    1. Increase in denominator of outstanding shares on conversion of preference shares
    2. Increase in the numerator (Net income available for common stockholders) by dividends on convertible preferred stock.

    Let’s understand this with the help of below example:

    Net income$11,800
    Ordinary shares 5,000 shares outstanding
    Preferred shares ($2 dividend per share each year)
    900 shares outstanding convertible into 2 ordinary shares
    Total Preference dividends for the year $1,800
    Basic EPS ($11,800 − $1,800) / 5,000 $2.00

    Adjusted net income attributable to ordinary shareholders =

    =11,800 + 1,800 ( Preference shares dividend no longer payable on conversion)

    = $13,600

    Number of shares outstanding on conversion of preference shares = 2000+ 1,800 = 3,800

    Diluted EPS = 13,600 / 3,800 = $3.58 per share

    Diluted EPS on Stock options using Treasury stock method

    An option or warrant gives the holder the right to buy shares at some time in the future at a predetermined price.

    Treasury-stock method assumes that proceeds received on exercise of the options is used to buy back shares at the average market price.

    To calculate diluted EPS with an option, you need to work out the number of ‘free’ shares that will be issued if the options are exercised, and add that to the weighted average number of shares

    Diluted EPS is calculated as if the financial instruments had been exercised and the company had used the proceeds from exercise to repurchase shares of common stock at the average market price of common stock during the period.

    The weighted average number of shares outstanding for diluted EPS is thus increased by the number of shares that would be issued upon exercise net of the number of shares that would have been purchased with the proceeds.

    We will understand this with the help of below example:

    Net income$12,000
    Ordinary shares shares outstanding2,000
    Basic EPS ($12,000) / 2,000) $6
    Stock options (200 options with exercise
    price of $80), 200 shares to be issued on exercise
    Average market price per ordinary share during
    the year
    $100

    Proceeds from exercise of options = 200 x $ 80 = $ 16,000

    No. of shares purchased from proceeds of exercise =$ 16,000 / 100 (average market price) =160 shares

    Total number of shares outstanding = 2000 + 200 – 160 = 2040 shares

    Diluted EPS = 12,000/2,040 shares = $5.88

    Antidilutive security

    Antidilutive security is a potentially convertible securities whose inclusion in the computation results in an increase in EPS than the basic EPS or a reduction in loss per share.

    Under IFRS and US GAAP, antidilutive securities are not included in the calculation of diluted EPS.

    Summary

    Diluted EPS is an important metric for investors to know how much will be the potential dilution in earning per share if all convertible securities were exercised.

    Related articles:

    What is Earning per share (EPS)

    What is PE Ratio?